SVG Diagram Type Templates
34 static SVG archetypes (Forge palette: cyan / amber / slate surfaces), extensible over time — aligned with diagram-as-code in the same design system: each family explains the closest native grammars, and each card lists matching types (e.g. flowchart, gantt, xychart-beta). Click a card for the modal legend. Scroll to diagram-as-code parallels for live samples per template key, or Diagram-as-code examples for the full mermaid@10 catalog (sequence, state, class, ER, C4, Git graph, …).
For JSON-driven metrics charts (same charts envelope as forge-lenses), see the Data charts hub (static · API fetch).
ASCII diagrams
In Markdown, the ```blueprint-diagram-ascii fence (alias ```ks-diagram-ascii) renders box-drawing in the same .forge-diagram shell as Mermaid and SVG tiles. Optional key:, alt:, caption:, and expand: lines form a prefix; the first line that does not match begins the art. With a valid catalog key: and expand: true, the figure opens the same legend modal as static SVG tiles. Heuristics for choosing key: from ASCII intent are in docs/ascii-to-ks-diagrams.md in the repository.
Example (static)
+------+     +------+     +------+
|  A   | --> |  B   | --> |  C   |
+------+ +------+ +------+Example (expand — click figure)
+------+     +------+
|  A   | --> |  B   |
+------+     +------+
Process & flow
How work moves through stages — same visual language as flowchart and journey-style narratives.
Primary diagram-as-code parallels: flowchart (LR/TD, decisions, subgraph swimlanes) and journey. Volume narrowing is approximated with sankey-beta on the Diagram-as-code examples page.

linear-flow
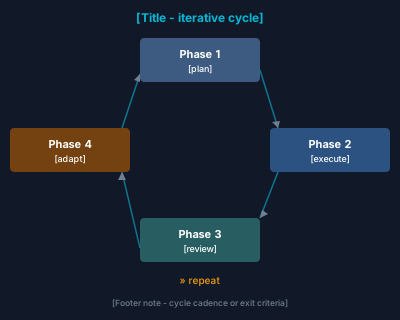
loop-cycle

gate-chain
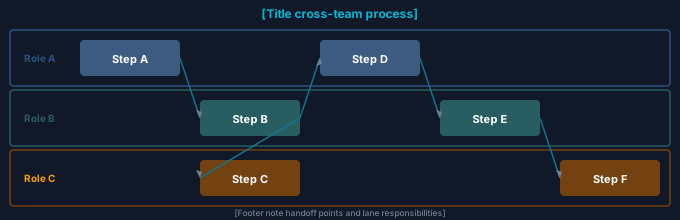
swimlane
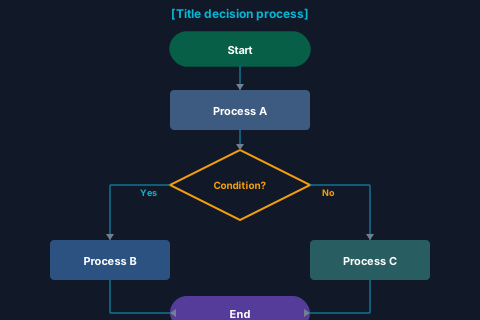
decision-flow
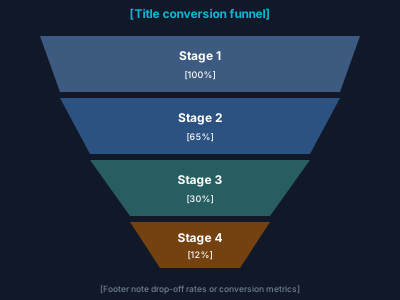
funnel
Structural & relational
Hierarchy, boards, and relationships — align with flowchart, mindmap, and (for networks) graph edges. Tree = generic node boxes; org chart = people cards (avatar, name, title, team line).
Maps to flowchart trees and org-style TD layouts, mindmap, and dense links similar to flowchart --- / --> edges. classDiagram / erDiagram cover typed relations on Diagram-as-code examples.
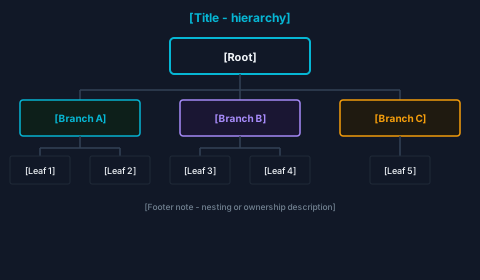
tree
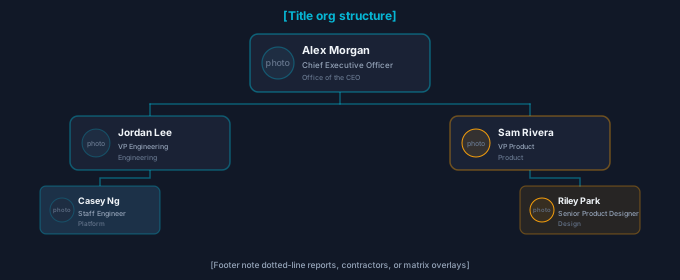
org-chart

board-columns
checklist
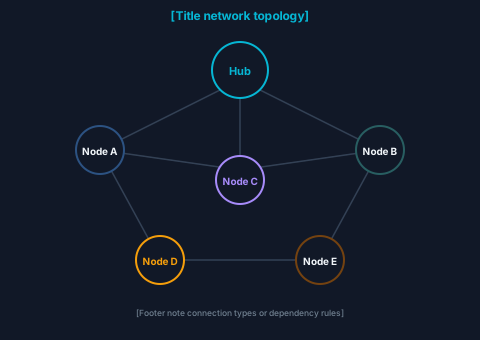
network
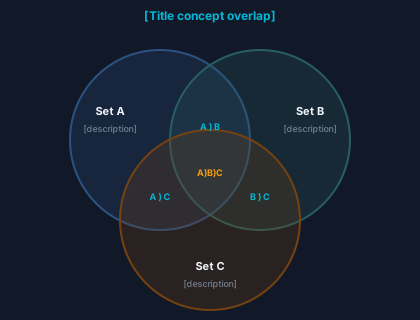
venn
Timeline & scheduling
Time-based views — pair with gantt and timeline grammars.
Direct grammars: gantt and timeline. Roadmaps often combine both; see Diagram-as-code examples.
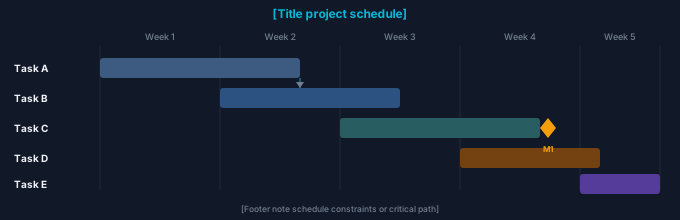
gantt
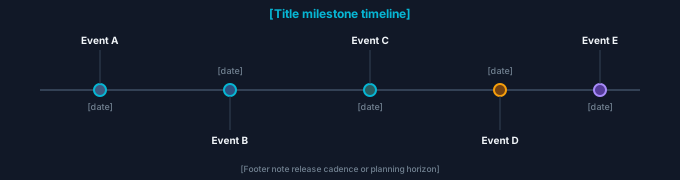
timeline
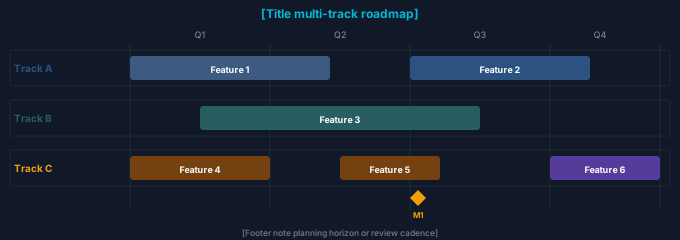
roadmap
Cartesian charts
Category and time-series on X/Y axes — bar, line, area, stacked bars, scatter, and waterfall bridges. Native grammars cover most via xychart-beta and quadrantChart; waterfall is SVG-first.
xychart-beta for bar, line, and multi-series; quadrantChart for scatter-like placement. Waterfall has no stock grammar in our pinned build — use the SVG template or BI tools. See Diagram-as-code examples.
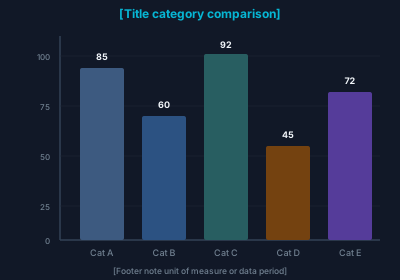
bar-chart
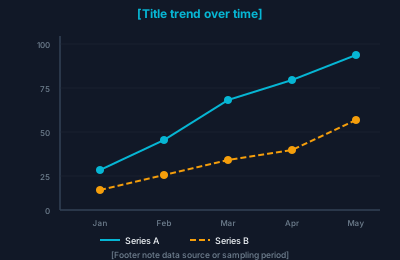
line-chart
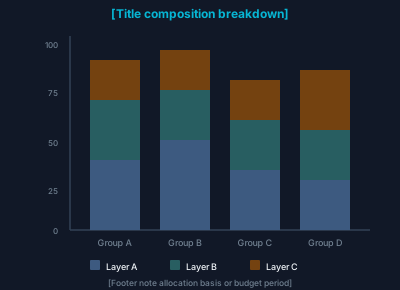
stacked-bar
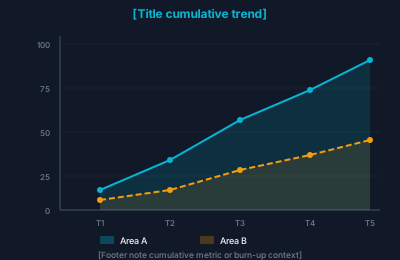
area-chart
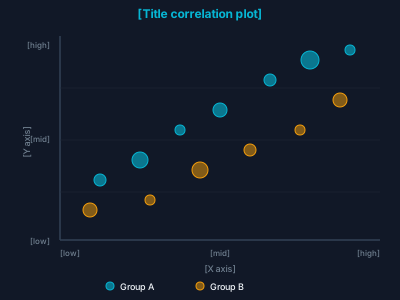
scatter
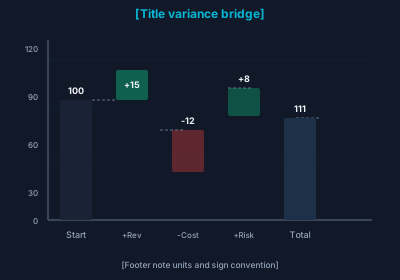
waterfall
Polar & composition
Parts-of-whole, multi-axis profiles, and nested rings — pie/donut, radar, and sunburst-style breakdowns. Only pie maps cleanly to native pie syntax; the rest are SVG-first.
pie is native. Radar and nested donut archetypes are Forge-styled SVG — use these cards or external charting. See Diagram-as-code examples for pie syntax.
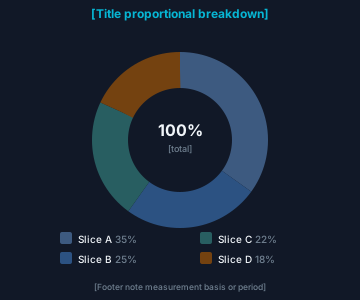
pie-donut
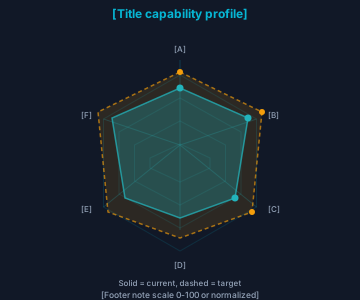
radar
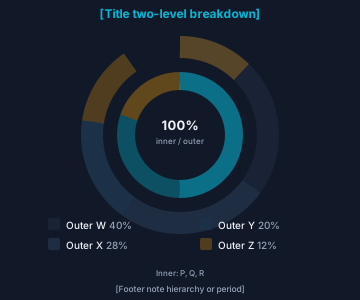
nested-donut
Comparison & status
Quadrants, gauges, KPI tiles, and bullet charts — quadrant via quadrantChart; gauges, bullets, and KPI cards are usually custom SVG or BI exports.
quadrantChart is native; gauges, KPI cards, and bullet charts have no stock type in our pinned build — keep these templates or embed from analytics tools.
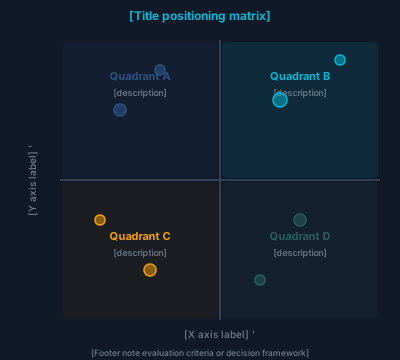
quadrant
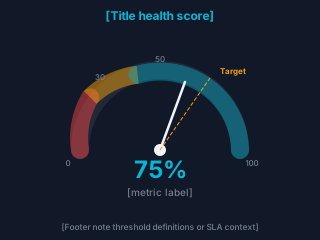
gauge
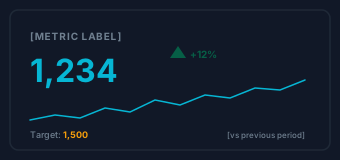
kpi-card
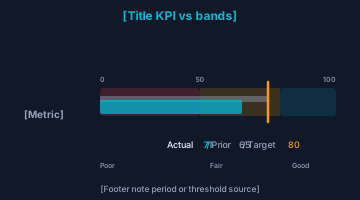
bullet-chart
Interaction & behavior
Message order across actors and finite-state lifecycles — pair with sequence and state diagrams.
Native: sequenceDiagram for lifelines and stateDiagram-v2 for states. Full syntax on Diagram-as-code examples.

sequence

state-machine
Autonomy methodology
Forge autonomy ladder, sub-level run evidence, and maturity score composition — content instances live in Blueprints and Platform handbooks.
SVG-first methodology diagrams; no diagram-as-code grammar. Content instances: methodology-autonomy-ladder-l1-l4-grades.svg and siblings in Blueprints.
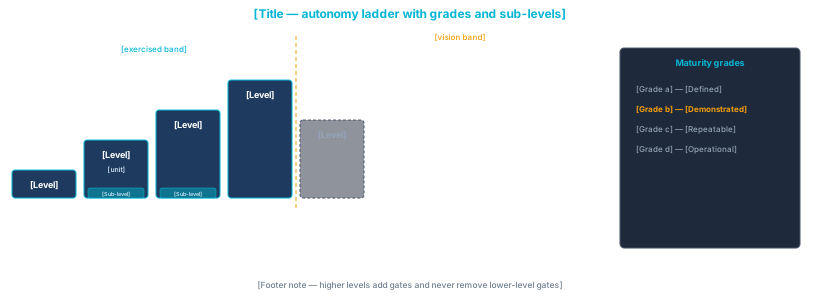
autonomy-ladder-grades
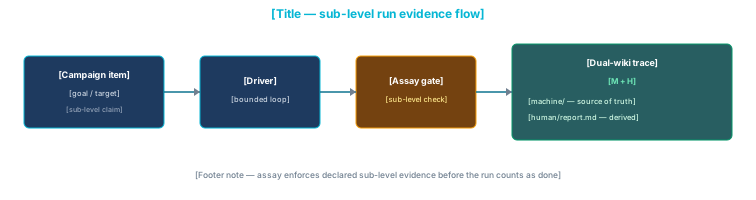
sublevel-run-evidence-flow
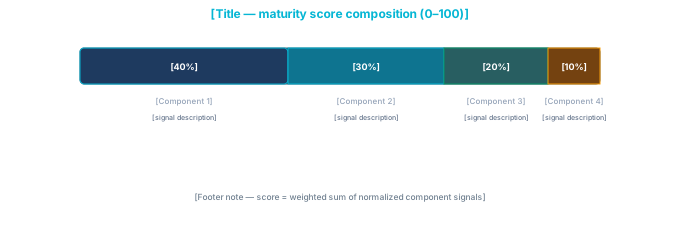
maturity-score-composition
Specialized
Heatmaps and other dense matrices — not in default bundle as first-class grammars.
No default mermaid@10 heatmap grammar; use this SVG archetype or external charting. Other specialized diagrams (e.g. requirementDiagram, gitGraph, C4) live on Diagram-as-code examples.
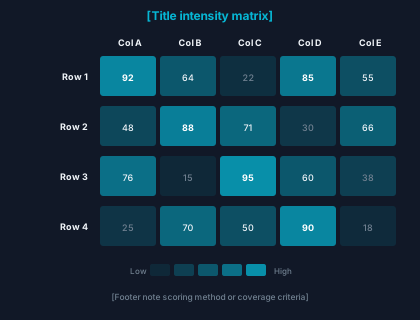
heatmap
Diagram-as-code parallels
Each block is diagram-as-code with the same render_mermaid_block wrapper as handbook and product pages. Use it when you want editable source; use the SVG cards above when you need exact Forge styling. Click a rendered diagram to open it in the lightbox (same as expandable blocks on handbook pages). Some archetypes have no close native grammar — keep the static template or use BI/design tools.
For the full catalog (C4, ER, Sankey, Git graph, …), see Diagram-as-code examples.
Process & flow
linear-flow (linear) · SVG family
loop-cycle (loop) · SVG family
gate-chain (gate) · SVG family
swimlane (swimlane) · SVG family
decision-flow (decision) · SVG family
funnel (funnel) · SVG family
Structural & relational
tree (tree) · SVG family
org-chart (orgchart) · SVG family
board-columns (board) · SVG family
checklist (checklist) · SVG family
network (network) · SVG family
venn (venn) · SVG family
No stock grammar matches this archetype; use the SVG template card or an external graphic.
Timeline & scheduling
gantt (gantt) · SVG family
timeline (timeline) · SVG family
roadmap (roadmap) · SVG family
Cartesian charts
bar-chart (bar) · SVG family
line-chart (line) · SVG family
stacked-bar (stacked) · SVG family
area-chart (area) · SVG family
scatter (scatter) · SVG family
waterfall (waterfall) · SVG family
No stock grammar matches this archetype; use the SVG template card or an external graphic.
Polar & composition
pie-donut (pie) · SVG family
radar (radar) · SVG family
No stock grammar matches this archetype; use the SVG template card or an external graphic.
nested-donut (nested-donut) · SVG family
No stock grammar matches this archetype; use the SVG template card or an external graphic.
Comparison & status
quadrant (quadrant) · SVG family
gauge (gauge) · SVG family
No stock grammar matches this archetype; use the SVG template card or an external graphic.
kpi-card (kpi) · SVG family
No stock grammar matches this archetype; use the SVG template card or an external graphic.
bullet-chart (bullet) · SVG family
No stock grammar matches this archetype; use the SVG template card or an external graphic.
Interaction & behavior
sequence (sequence) · SVG family
state-machine (state) · SVG family
Autonomy methodology
autonomy-ladder-grades (autonomy-ladder) · SVG family
No sample wired for this key yet.
sublevel-run-evidence-flow (sublevel-run-flow) · SVG family
No sample wired for this key yet.
maturity-score-composition (maturity-score) · SVG family
No sample wired for this key yet.
Specialized
heatmap (heatmap) · SVG family
No stock grammar matches this archetype; use the SVG template card or an external graphic.